Dashboard
Dashboards provide a customizable overview of your workarea with configurable widgets for visualizing item data, tracking metrics, and monitoring progress.
Managing Dashboards
You can create multiple dashboards per workarea. Dashboards live in the Explorer tree in the sidebar — alongside documents, organized into folders — and each has its own URL you can bookmark or share. An Overview dashboard is created automatically on first visit.
- Create a dashboard with the New button in the toolbar, or via the Explorer’s + menu (New dashboard); new dashboards open directly in edit mode
- Rename, describe, or delete a dashboard from the Properties panel — edits are batched behind Save
- The Properties panel also sets the dashboard’s grid columns and holds file attachments (drag-and-drop, up to 50 MB each)
Edit Mode
Click Edit in the toolbar to customize the dashboard. Save and Cancel replace it while editing:
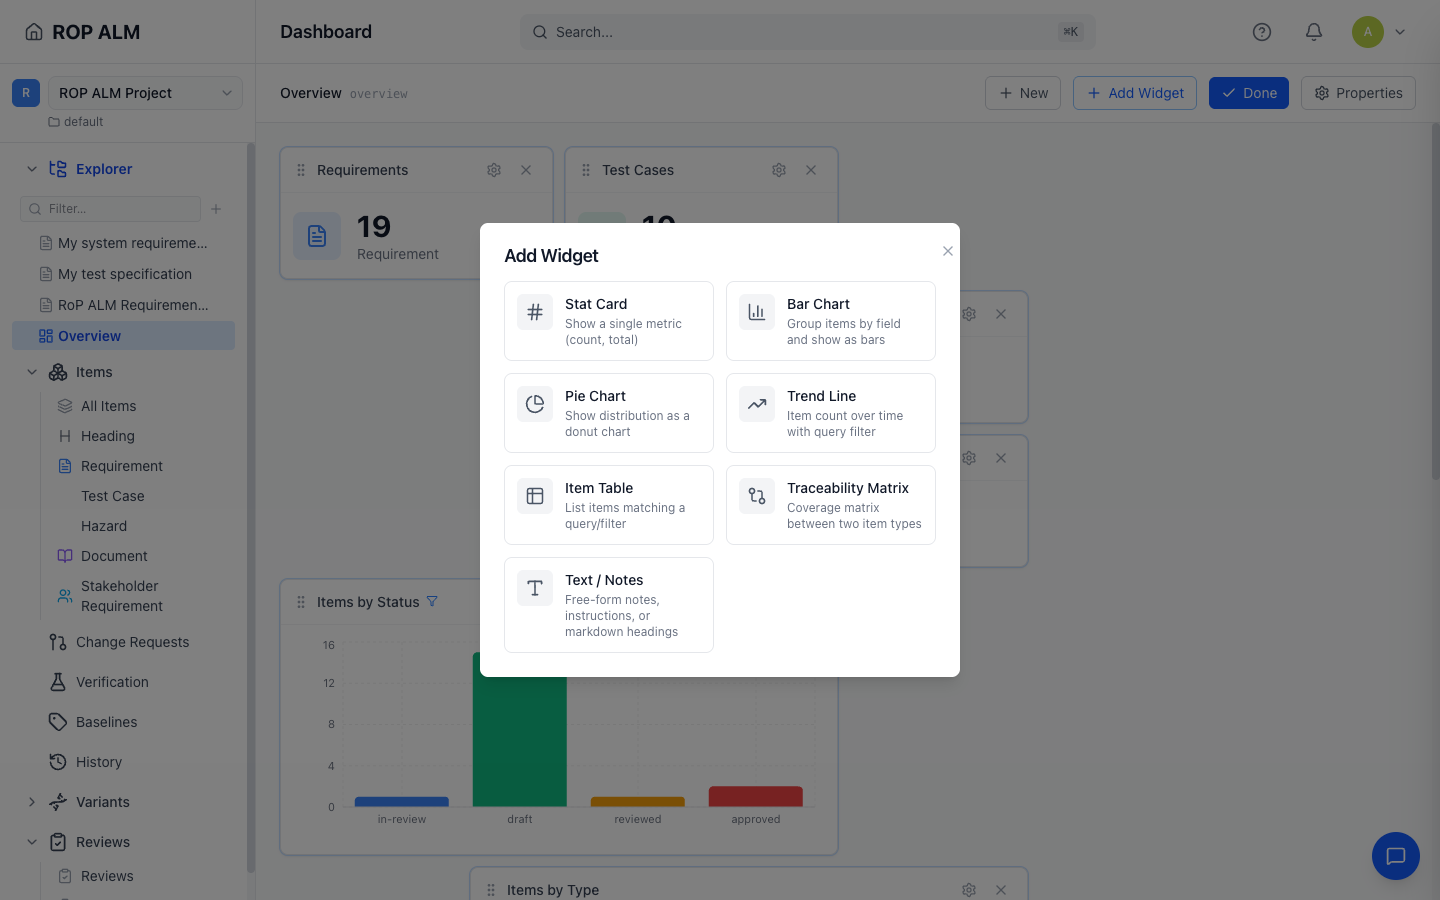
- Add Widget opens the widget picker — see Widgets & Plugins for the widget types, plugins, and their settings
- Drag widgets to reorder them
- Resize widgets by dragging their edges
- Configure a widget with its gear icon — every widget has a title and most accept a query-language filter
- Remove widgets with the delete button
Edits are held in the browser during the session and committed only when you click Save (the button shows a * while there are unsaved changes). Cancel discards them (it confirms first if there are changes), and closing the tab mid-edit warns you. Because dashboards are git-backed, this keeps a single commit per edit session instead of one per drag.
Widget Types
| Widget | Description | Configuration |
|---|---|---|
| Stat Card | Single metric (Total Items, Items by Type, Items by Status, Total Commits, Total Baselines) | Metric, query filter, color |
| Bar Chart | Items grouped by a field | Group by Status or Type, query filter |
| Pie Chart | Distribution as a donut chart | Group by Status or Type, query filter |
| Trend Line | Item count over time | Time range, granularity, date field, display mode (cumulative or per-period) |
| Item Table | List of items | Max rows, query filter |
| Traceability Matrix | Link coverage between item types | Source type, target type, link type |
| Activity Feed | Recent commits — author, relative time, baseline tag, and clickable affected-item chips | Commits to load, Show affected items |
| Text / Notes | Free-form notes, instructions, or markdown headings | Markdown content |
Default Widgets
A new Overview dashboard includes:
- 4 stat cards — Requirements, Test Cases, Hazards, and Baselines counts
- Bar chart — Items by Status
- Pie chart — Items by Type
- Item table — Recent Items (8 rows)
Widget Layout
Widgets are arranged on a grid — 12 columns by default, configurable per dashboard in the Properties panel. The grid adapts to narrower screens automatically.
Baseline Mode
When viewing a baseline, the dashboard title shows the active baseline name and all widgets display data from that snapshot. Editing is disabled in baseline mode.